爱极客专注分享-好玩的docker应用-源码分享

抛弃ADguardhome轻松搭建无污染dns及ui显示界面,预防DNS泄漏

20240314212257905-mosdns可视化.zip
zip文件
258.7K
抛弃ADguardhome轻松搭建无污染dns及ui显示界面,预防DNS泄漏

我之前是通过旁路由打开mosdns做dns解析及分流,但是我平时经常爱折腾加上openwrt插件太多兼容性问题,导致openwrt经常挂掉,然后家里就断网了。

所以一个稳定且强大的DNS服务器无疑是家庭网络中不可缺少的一环。

因此,我为您准备了一篇详细的指南,搭建一个独立的dns服务器及ui显示界面,从而提高网络的稳定性和响应速度。

项目介绍

mosdns:一个 DNS 转发器

项目地址:https://github.com/IrineSistiana/mosdns

easymosdns:基于Mosdns的精准DNS分流策略,仅需几分钟即可搭建一台支持ECS的无污染DNS服务器。

https://github.com/pmkol/easymosdns

Prometheus:是云原生计算基金会项目,是一个系统和服务监控系统

项目地址:https://github.com/prometheus/prometheus

grafana:用于监控和可观察的开源平台

项目地址:https://github.com/grafana/grafana

exsi安装debian12系统

网上有保姆级教程,我这里就不介绍了。

【保姆级教程】Debian12虚拟机安装教程

固定ip地址

nano /etc/network/interfaces

把网卡的dhcp改成static,address是ip地址,netmask是子网掩码,gateway是网关

iface ens192 inet static
address 10.0.0.222
netmask 255.255.255.0
gateway 10.0.0.1
dns-nameservers 127.0.0.1
iface ens192 inet6 dhcp

更完玩重启服务器,随后用ssh通过修改完的ip地址登录

reboot

easymosdns安装步骤

首先,我们需要安装easymosdns。

我会把脚本打包放在文章底部。

该过程简洁明了,只需遵循以下几个步骤:

上传脚本dns-ui到root目录下

抛弃ADguardhome轻松搭建无污染dns及ui显示界面,预防DNS泄漏

脚本权限修改

首先,为安装脚本授予可执行权限:

chmod +x dns-ui.sh

执行安装脚本

然后,执行脚本以启动安装过程:

./dns-ui.sh

脚本中包含了常用的组件以及docker

配置文件的调整

进入mosdns程序目录

cd /etc/mosdns

删掉原本mosdns的config文件,替换目录下的config1.yml

rm config.yaml
mv config1.yaml config.yaml

如果自己会用mosdns也可根据您的需求调整配置文件的内容。

重启easymosdns服务

应用配置后重启服务以确保更改生效:

mosdns service restart

确认安装成功

最后,检查服务状态以验证安装是否成功:

mosdns service status
抛弃ADguardhome轻松搭建无污染dns及ui显示界面,预防DNS泄漏

至此mosdns的安装已完成

安装grafana和Prometheus

创建启动文件的配置

接下来我们需要创建并配置启动文件:

mkdir -p /home/docker/prometheus/

之后,将先前下载好的prometheus.yml文件移至此配置文件夹内。

抛弃ADguardhome轻松搭建无污染dns及ui显示界面,预防DNS泄漏
# prometheus.yml

global:
  scrape_interval:     15s # Set the scrape interval to every 15 seconds. Default is every 1 minute.
  evaluation_interval: 15s # Evaluate rules every 15 seconds. The default is every 1 minute.
  # scrape_timeout is set to the global default (10s).

  # Attach these labels to any time series or alerts when communicating with
  # external systems (federation, remote storage, Alertmanager).
  external_labels:
      monitor: 'example'

# Alertmanager configuration
alerting:
  alertmanagers:
  - static_configs:
    - targets: ['localhost:9093']

# Load rules once and periodically evaluate them according to the global 'evaluation_interval'.
rule_files:
  # - "first_rules.yml"
  # - "second_rules.yml"

# A scrape configuration containing exactly one endpoint to scrape:
# Here it's Prometheus itself.
scrape_configs:
  # The job name is added as a label `job=<job_name>` to any timeseries scraped from this config.
  - job_name: 'prometheus'

    # Override the global default and scrape targets from this job every 5 seconds.
    scrape_interval: 5s
    scrape_timeout: 5s

    # metrics_path defaults to '/metrics'
    # scheme defaults to 'http'.

    static_configs:
      - targets: ['localhost:9090']

  - job_name: node
    # If prometheus-node-exporter is installed, grab stats about the local
    # machine by default.
    static_configs:
      - targets: ['localhost:9100']

  - job_name: mosdns
    static_configs:
      - targets: ['localhost:9080']

进入docker文件夹下

cd /home/docker

上传docker-compose.yml文件

抛弃ADguardhome轻松搭建无污染dns及ui显示界面,预防DNS泄漏
# docker-compose.yml
version: '3'
services:
  grafana:
    image: grafana/grafana-oss:latest
    container_name: grafana
    restart: always
    user: root
    network_mode: host
    volumes:
      - /home/docker/grafana/data:/var/lib/grafana
      - /home/docker/grafana/panels:/etc/dashboards
      - /home/docker/grafana/provisioning/dashboards:/etc/grafana/provisioning/dashboards
      - /home/docker/grafana/provisioning/datasources:/etc/grafana/provisioning/datasources
  prometheus:
    image: prom/prometheus
    container_name: prometheus
    hostname: prometheus
    restart: always
    user: root
    network_mode: host
    volumes:
      - /home/docker/prometheus/prometheus.yml:/etc/prometheus/prometheus.yml

Docker安装相关文件

docker-compose up -d

可通过一下命令查看docker容器是否已运行

docker ps
抛弃ADguardhome轻松搭建无污染dns及ui显示界面,预防DNS泄漏

可视化配置步骤

Grafana软件配置

以Grafana为例,我们可以进行如下几步配置来优化您的可视化体验:

修改默认数据库地址
打开Grafana,将默认数据库地址更改为:

http://localhost:9090
抛弃ADguardhome轻松搭建无污染dns及ui显示界面,预防DNS泄漏

修改默认语言
根据您的偏好,调整界面语言设置。

抛弃ADguardhome轻松搭建无污染dns及ui显示界面,预防DNS泄漏

面板导入
根据需要,导入dns.json监控面板配置文件。

抛弃ADguardhome轻松搭建无污染dns及ui显示界面,预防DNS泄漏
//dns.json
{
  "annotations": {
    "list": [
      {
        "builtIn": 1,
        "datasource": {
          "type": "grafana",
          "uid": "-- Grafana --"
        },
        "enable": true,
        "hide": true,
        "iconColor": "rgba(0, 211, 255, 1)",
        "name": "Annotations & Alerts",
        "target": {
          "limit": 100,
          "matchAny": false,
          "tags": [],
          "type": "dashboard"
        },
        "type": "dashboard"
      }
    ]
  },
  "editable": true,
  "fiscalYearStartMonth": 0,
  "graphTooltip": 0,
  "id": 1,
  "links": [],
  "liveNow": false,
  "panels": [
    {
      "datasource": {
        "type": "prometheus",
        "uid": "L9I00Ch4z"
      },
      "description": "",
      "fieldConfig": {
        "defaults": {
          "mappings": [],
          "thresholds": {
            "mode": "absolute",
            "steps": [
              {
                "color": "green",
                "value": null
              }
            ]
          },
          "unit": "short"
        },
        "overrides": []
      },
      "gridPos": {
        "h": 4,
        "w": 4,
        "x": 0,
        "y": 0
      },
      "id": 12,
      "options": {
        "colorMode": "value",
        "graphMode": "area",
        "justifyMode": "auto",
        "orientation": "auto",
        "reduceOptions": {
          "calcs": [
            "lastNotNull"
          ],
          "fields": "",
          "values": false
        },
        "textMode": "auto"
      },
      "pluginVersion": "9.3.2",
      "targets": [
        {
          "datasource": {
            "type": "prometheus",
            "uid": "KMq0zgV4k"
          },
          "editorMode": "code",
          "expr": "increase(mosdns_plugin_cache_lan_hit_total{job=\"mosdns\"}[$__range])",
          "hide": false,
          "legendFormat": "__auto",
          "range": true,
          "refId": "A"
        }
      ],
      "title": "缓存命中数量",
      "type": "stat"
    },
    {
      "datasource": {
        "type": "prometheus",
        "uid": "L9I00Ch4z"
      },
      "description": "",
      "fieldConfig": {
        "defaults": {
          "mappings": [],
          "thresholds": {
            "mode": "absolute",
            "steps": [
              {
                "color": "green",
                "value": null
              }
            ]
          },
          "unit": "short"
        },
        "overrides": []
      },
      "gridPos": {
        "h": 4,
        "w": 4,
        "x": 4,
        "y": 0
      },
      "id": 20,
      "options": {
        "colorMode": "value",
        "graphMode": "area",
        "justifyMode": "auto",
        "orientation": "auto",
        "reduceOptions": {
          "calcs": [
            "lastNotNull"
          ],
          "fields": "",
          "values": false
        },
        "textMode": "auto"
      },
      "pluginVersion": "9.3.2",
      "targets": [
        {
          "datasource": {
            "type": "prometheus",
            "uid": "KMq0zgV4k"
          },
          "editorMode": "code",
          "expr": "increase(mosdns_plugin_met_query_total{job=\"mosdns\"}[$__range])",
          "hide": false,
          "legendFormat": "__auto",
          "range": true,
          "refId": "A"
        }
      ],
      "title": "DNS查询数量",
      "type": "stat"
    },
    {
      "datasource": {
        "type": "prometheus",
        "uid": "L9I00Ch4z"
      },
      "fieldConfig": {
        "defaults": {
          "mappings": [],
          "max": 1,
          "min": 0,
          "thresholds": {
            "mode": "percentage",
            "steps": [
              {
                "color": "green",
                "value": null
              },
              {
                "color": "orange",
                "value": 5
              },
              {
                "color": "red",
                "value": 10
              }
            ]
          },
          "unit": "percentunit"
        },
        "overrides": []
      },
      "gridPos": {
        "h": 8,
        "w": 4,
        "x": 8,
        "y": 0
      },
      "id": 16,
      "options": {
        "orientation": "auto",
        "reduceOptions": {
          "calcs": [
            "lastNotNull"
          ],
          "fields": "",
          "values": false
        },
        "showThresholdLabels": false,
        "showThresholdMarkers": true
      },
      "pluginVersion": "9.3.2",
      "targets": [
        {
          "datasource": {
            "type": "prometheus",
            "uid": "L9I00Ch4z"
          },
          "editorMode": "code",
          "expr": "increase(mosdns_plugin_cache_lan_hit_total{job=\"mosdns\"}[$__range])/increase(mosdns_plugin_cache_lan_query_total{job=\"mosdns\"}[$__range])",
          "hide": false,
          "legendFormat": "__auto",
          "range": true,
          "refId": "A"
        }
      ],
      "title": "DNS 缓存命中率",
      "type": "gauge"
    },
    {
      "datasource": {},
      "fieldConfig": {
        "defaults": {
          "mappings": [],
          "thresholds": {
            "mode": "absolute",
            "steps": [
              {
                "color": "green",
                "value": null
              },
              {
                "color": "yellow",
                "value": 10
              },
              {
                "color": "orange",
                "value": 100
              },
              {
                "color": "red",
                "value": 500
              }
            ]
          },
          "unit": "ms"
        },
        "overrides": []
      },
      "gridPos": {
        "h": 4,
        "w": 4,
        "x": 0,
        "y": 4
      },
      "id": 10,
      "options": {
        "colorMode": "value",
        "graphMode": "area",
        "justifyMode": "auto",
        "orientation": "auto",
        "reduceOptions": {
          "calcs": [
            "lastNotNull"
          ],
          "fields": "",
          "values": false
        },
        "textMode": "auto"
      },
      "pluginVersion": "9.3.2",
      "targets": [
        {
          "datasource": {
            "type": "prometheus",
            "uid": "KMq0zgV4k"
          },
          "editorMode": "code",
          "expr": "increase(mosdns_plugin_met_response_latency_millisecond_sum{job=\"mosdns\"}[$__range])/increase(mosdns_plugin_met_response_latency_millisecond_count{job=\"mosdns\"}[$__range])",
          "legendFormat": "__auto",
          "range": true,
          "refId": "A"
        }
      ],
      "title": "DNS 响应延迟",
      "type": "stat"
    },
    {
      "datasource": {
        "type": "prometheus",
        "uid": "L9I00Ch4z"
      },
      "fieldConfig": {
        "defaults": {
          "mappings": [],
          "max": 1,
          "min": 0,
          "thresholds": {
            "mode": "percentage",
            "steps": [
              {
                "color": "green",
                "value": null
              },
              {
                "color": "orange",
                "value": 5
              },
              {
                "color": "red",
                "value": 10
              }
            ]
          },
          "unit": "percentunit"
        },
        "overrides": []
      },
      "gridPos": {
        "h": 4,
        "w": 4,
        "x": 4,
        "y": 4
      },
      "id": 8,
      "options": {
        "orientation": "auto",
        "reduceOptions": {
          "calcs": [
            "lastNotNull"
          ],
          "fields": "",
          "values": false
        },
        "showThresholdLabels": false,
        "showThresholdMarkers": true
      },
      "pluginVersion": "9.3.2",
      "targets": [
        {
          "datasource": {
            "type": "prometheus",
            "uid": "KMq0zgV4k"
          },
          "editorMode": "code",
          "expr": "increase(mosdns_plugin_met_err_total{job=\"mosdns\"}[$__range])/increase(mosdns_plugin_met_query_total{job=\"mosdns\"}[$__range])",
          "hide": false,
          "legendFormat": "__auto",
          "range": true,
          "refId": "A"
        }
      ],
      "title": "DNS 查询错误率",
      "type": "gauge"
    },
    {
      "datasource": {
        "type": "prometheus",
        "uid": "L9I00Ch4z"
      },
      "fieldConfig": {
        "defaults": {
          "custom": {
            "hideFrom": {
              "legend": false,
              "tooltip": false,
              "viz": false
            },
            "scaleDistribution": {
              "type": "linear"
            }
          }
        },
        "overrides": []
      },
      "gridPos": {
        "h": 6,
        "w": 12,
        "x": 0,
        "y": 8
      },
      "id": 6,
      "interval": "30s",
      "maxDataPoints": 50,
      "options": {
        "calculate": false,
        "cellGap": 1,
        "cellValues": {
          "unit": "none"
        },
        "color": {
          "exponent": 0.5,
          "fill": "dark-orange",
          "mode": "scheme",
          "reverse": false,
          "scale": "exponential",
          "scheme": "RdYlGn",
          "steps": 64
        },
        "exemplars": {
          "color": "rgba(255,0,255,0.7)"
        },
        "filterValues": {
          "le": 1e-9
        },
        "legend": {
          "show": true
        },
        "rowsFrame": {
          "layout": "auto",
          "value": "Count"
        },
        "tooltip": {
          "show": true,
          "yHistogram": false
        },
        "yAxis": {
          "axisLabel": "Latency",
          "axisPlacement": "left",
          "decimals": 0,
          "reverse": false,
          "unit": "ms"
        }
      },
      "pluginVersion": "9.3.2",
      "targets": [
        {
          "datasource": {
            "type": "prometheus",
            "uid": "KMq0zgV4k"
          },
          "editorMode": "code",
          "expr": "ceil(increase(mosdns_plugin_met_response_latency_millisecond_bucket{le!=\"+Inf\"}[$__interval]))",
          "format": "heatmap",
          "hide": false,
          "legendFormat": "{{le}}",
          "range": true,
          "refId": "A"
        }
      ],
      "title": "DNS 响应延迟热图",
      "type": "heatmap"
    }
  ],
  "refresh": "5s",
  "schemaVersion": 37,
  "style": "dark",
  "tags": [],
  "templating": {
    "list": []
  },
  "time": {
    "from": "now/d",
    "to": "now"
  },
  "timepicker": {},
  "timezone": "",
  "title": "mosdns",
  "uid": "w-Sdzen4k",
  "version": 19,
  "weekStart": ""
}

逐行启用
逐项启用并配置相应的面板选项。

抛弃ADguardhome轻松搭建无污染dns及ui显示界面,预防DNS泄漏

日志文件优化

为了保持系统的整洁和高效运行,我们可以通过定期清理日志文件来优化性能:

crontab -e

在文件末尾添加以下内容,以定时清理DNS服务的日志文件:

0 5 * * * sudo truncate -s 0 /etc/mosdns/mosdns.log && /etc/mosdns/rules/update-cdn

通过上述步骤,您不仅可以减少家庭网络中的断网情况,还能获得一个更加稳定、高效的DNS服务。
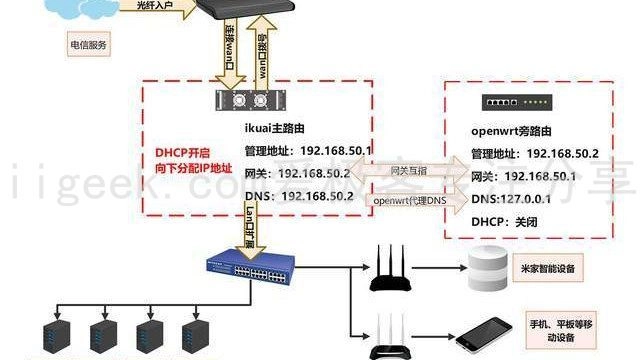
如何使用DNS服务器

家里想使用dns服务器的可以网关指向这个服务器的ip地址

如果想整个网络环境都是用,那可以主路由套娃的形式指向这个dns服务器

© 版权声明
THE END
喜欢就支持一下吧
点赞14赞赏 分享
评论 抢沙发
头像
欢迎您留下宝贵的见解!
提交
头像

昵称

取消
昵称表情代码图片

    暂无评论内容